You may also like
Triple Screen Trading Dr. Alexander Elder trading system for TC2000. Stock books about technical analysis. Books and Videos on momentum, swing and day trading

Hit and Run trading system for TC2000. Stock books about technical analysis. Books and Videos on momentum, swing and day trading
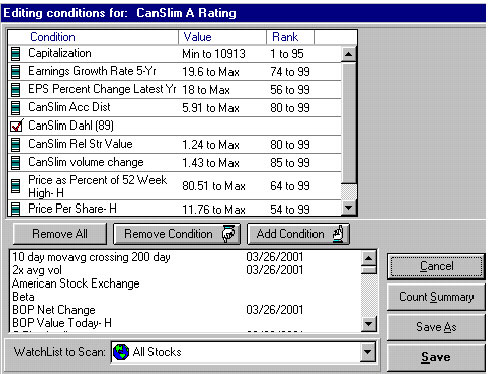
Canslim trading system for TC2000. Stock books about technical analysis. Books and Videos on momentum, swing and day trading

Ed Mulroy Stock Trading Scans TC2000 trading system, PCF for TC2000. Stock books about technical analysis. Books and Videos on momentum, swing and day trading